
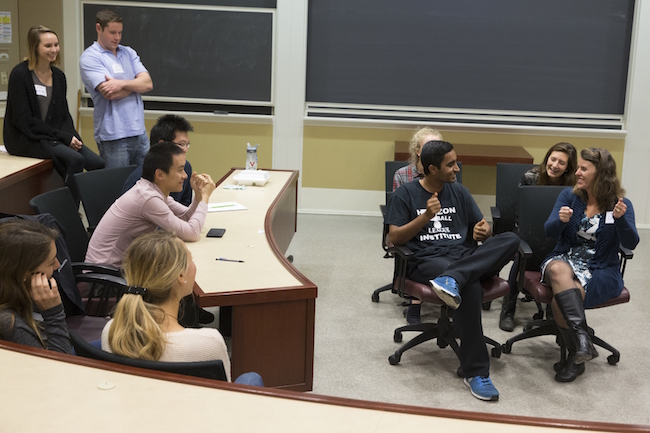
An improv class at the University of Virginia’s McIntire School of Commerce, which finished third in this year’s Poets&Quants ranking of best undergraduate business programs. Professor Cady Garey is on the far right, seated in the blue sweater. Photo by Dan Addison, University of Virginia Communications
Academic Experience
The data below was collected from our survey of the Class of 2018.
| School | Experience Total | Scaled Questions (Weighted 80%) | Desired Jobs Average (Weighted 10%) | Signature Experience and International Experience Average (Weighted 10%) |
|---|---|---|---|---|
| University of Virginia (McIntire) | 100.00 | 9.281875 | 88.69% | 70.84% |
| Bucknell University | 98.59 | 9.183125 | 96.16% | 59.62% |
| Indiana University (Kelley) | 98.40 | 9.185 | 89.66% | 63.71% |
| Georgia Institute of Technology (Scheller) | 97.59 | 9.35 | 91.84% | 42.86% |
| New York University (Stern) | 97.16 | 8.80125 | 84.53% | 86.31% |
| University of Illinois (Gies) | 96.98 | 9.0425 | 91.11% | 61.11% |
| University of Pennsylvania (Wharton) | 96.98 | 9.28 | 78.33% | 55.00% |
| University of Texas-Austin (McCombs) | 96.59 | 9.044375 | 86.48% | 61.89% |
| Texas Christian University (Neely) | 95.92 | 8.963125 | 90.18% | 58.93% |
| Wake Forest University | 95.76 | 8.98875 | 88.58% | 57.15% |
| University of Notre Dame (Mendoza) | 95.56 | 9.11125 | 91.08% | 44.20% |
| Villanova University | 95.17 | 8.9825 | 87.32% | 53.82% |
| Southern Methodist University (Cox) | 95.14 | 9.195 | 85.98% | 39.03% |
| University of Michigan (Ross) | 94.73 | 8.919375 | 75.87% | 65.04% |
| Georgetown University (McDonough) | 94.45 | 8.764375 | 86.37% | 64.78% |
| Hult International Business School | 94.41 | 8.75375 | 70.97% | 79.03% |
| University of North Carolina (Kenan-Flagler) | 94.26 | 8.736875 | 84.22% | 67.11% |
| Cornell University (SC Johnson) | 94.24 | 9.045 | 91.67% | 37.50% |
| University of Wisconsin | 93.37 | 8.795 | 87.18% | 52.76% |
| University of Minnesota (Carlson) | 93.00 | 8.460625 | 76.04% | 84.31% |
| Elon University (Love) | 92.89 | 8.640625 | 85.40% | 61.69% |
| Miami University (Farmer) | 92.86 | 8.554375 | 85.77% | 67.52% |
| Fordham University (Gabelli) | 92.44 | 8.83875 | 76.86% | 50.96% |
| Bowling Green State University | 92.23 | 8.70375 | 75.65% | 60.26% |
| Duquesne University | 92.01 | 8.676875 | 82.41% | 54.39% |
| Lehigh University | 91.93 | 8.57875 | 86.80% | 56.97% |
| Brigham Young University (Marriott) | 91.71 | 8.7925 | 83.91% | 41.96% |
| Northeastern University (D’Amore-McKim) | 91.11 | 8.4275 | 80.65% | 66.83% |
| Boston University (Questrom) | 91.05 | 8.55625 | 77.22% | 59.93% |
| Northern Illinois University | 90.93 | 8.738125 | 85.37% | 38.18% |
| Emory University (Goizueta) | 90.87 | 8.566875 | 89.76% | 46.39% |
| Ohio University | 90.81 | 8.579375 | 79.39% | 54.23% |
| University of Massachuessets-Amherst (Isenberg) | 90.75 | 8.705 | 84.03% | 40.28% |
| University of New Hampshire (Paul) | 90.73 | 8.6925 | 85.50% | 39.75% |
| Worcester Polytechnic Institute (Foisie) | 90.59 | 8.428125 | 78.57% | 64.29% |
| Christopher Newport University | 90.55 | 8.801875 | 77.30% | 37.50% |
| University of Georgia (Terry) | 90.34 | 8.65625 | 83.01% | 41.36% |
| University of Tennessee-Knoxville (Haslam) | 89.79 | 8.385625 | 86.11% | 53.96% |
| University of Pittsburgh | 89.74 | 8.498125 | 79.81% | 50.97% |
| University of Richmond (Robins) | 89.74 | 8.633125 | 80.36% | 40.48% |
| University of Arizona (Eller) | 89.60 | 8.64375 | 81.48% | 37.50% |
| Santa Clara University (Leavey) | 89.47 | 8.42875 | 82.44% | 51.39% |
| Michigan State University (Broad) | 89.40 | 8.58375 | 82.23% | 39.58% |
| Marian University (Indiana) | 89.15 | 8.725 | 58.70% | 48.22% |
| University of Houston (Bauer) | 89.10 | 8.79625 | 74.02% | 28.74% |
| The College of William & Mary (Mason) | 88.94 | 8.726875 | 77.78% | 29.17% |
| Providence College | 88.93 | 8.6125 | 78.27% | 37.13% |
| University of San Diego | 88.88 | 8.493125 | 68.18% | 54.55% |
| University of Denver (Daniels) | 88.54 | 8.29375 | 76.05% | 59.38% |
| Texas Tech University (Rawls) | 88.40 | 8.490625 | 86.35% | 34.40% |
| Binghamton University | 88.28 | 8.3825 | 80.21% | 46.88% |
| Washington University in St. Louis (Olin) | 88.18 | 8.18875 | 81.76% | 59.00% |
| University of North Carolina – Wilmington (Cameron) | 88.09 | 8.470625 | 63.46% | 53.85% |
| Carnegie Mellon University (Tepper) | 87.88 | 8.30625 | 81.82% | 47.73% |
| St. Thomas University (Opus) | 87.52 | 8.31875 | 74.64% | 50.26% |
| University of Washington (Foster) | 87.52 | 8.159375 | 72.30% | 64.10% |
| University of Texas-Dallas | 87.45 | 8.544375 | 72.69% | 34.78% |
| Tulane University (A. B. Freeman) | 87.40 | 8.255 | 83.81% | 45.75% |
| Seattle University (Albers) | 87.15 | 8.4925 | 70.73% | 37.81% |
| University of the Pacific | 86.90 | 8.64875 | 59.38% | 34.38% |
| Drexel University (LeBow) | 86.83 | 8.215 | 80.19% | 47.17% |
| Purdue University (Krannert) | 86.65 | 8.361875 | 84.55% | 30.91% |
| Lipscomb University | 86.04 | 8.193125 | 71.43% | 50.00% |
| University of South Carolina (Darla Moore) | 85.71 | 8.14 | 75.22% | 47.83% |
| Syracuse University (Whitman) | 85.68 | 8.000625 | 77.28% | 55.97% |
| Rutgers Business School (New Brunswick) | 85.55 | 8.3975 | 78.35% | 24.66% |
| The College of New Jersey | 85.15 | 8.15875 | 65.98% | 50.00% |
| St. John’s University (Tobin) | 83.77 | 8.088125 | 72.64% | 37.74% |
| Florida Southern College | 83.39 | 8.109375 | 58.34% | 45.83% |
| University of Utah (Eccles) | 83.36 | 7.961875 | 76.55% | 40.12% |
| University of Oklahoma (Price) | 82.88 | 7.661875 | 76.98% | 57.90% |
| University of Delaware (Lerner) | 82.80 | 7.80125 | 74.57% | 49.12% |
| University of Michigan-Dearborn | 82.53 | 8.113125 | 70.17% | 27.78% |
| University of Miami (Herbert) | 81.90 | 8.095 | 74.45% | 20.00% |
| Saint Louis University (Chaifetz) | 81.88 | 7.744375 | 80.19% | 40.57% |
| Sacred Heart University (Jack Welch) | 81.66 | 7.87625 | 63.10% | 44.34% |
| Rutgers Business School (Newark) | 81.32 | 8.09625 | 63.63% | 24.71% |
| Evansville University | 81.12 | 7.634375 | 70.00% | 51.43% |
| American University (Kogod) | 80.25 | 7.70875 | 68.29% | 40.24% |
| Rochester Institute of Technology (Saunders) | 79.60 | 7.363125 | 67.86% | 60.71% |
| University of Akron | 79.28 | 7.50125 | 80.85% | 36.18% |
| University of Kentucky (Gatton) | 77.80 | 7.54625 | 67.53% | 32.47% |
| Hofstra University (Zarb) | 75.47 | 7.446875 | 53.41% | 32.96% |
| Oregon State University | 73.56 | 7.19625 | 58.34% | 31.11% |
| Ohio State University (Fisher) | 43.57 | 4.19375 | 39.35% | 19.19% |
| Auburn University (Harbert) | 43.38 | 4.144375 | 40.91% | 19.86% |
| Iowa State University (Ivy) | 42.82 | 4.1084375 | 39.21% | 19.32% |
| George Washington University | 42.47 | 4.1196875 | 45.66% | 9.79% |
| North Carolina State University | 41.04 | 3.9390625 | 35.47% | 20.35% |
| Florida International University | 40.67 | 4.1184375 | 29.20% | 9.60% |
| University of Texas-Arlington | 35.49 | 3.3890625 | 32.86% | 16.88% |
| University of New Mexico (Anderson) | 34.88 | 3.4925 | 25.00% | 11.24% |
| Ithaca College | 34.60 | 3.4859375 | 25.00% | 9.38% |
© Copyright 2026 Poets & Quants. All rights reserved. This article may not be republished, rewritten or otherwise distributed without written permission. To reprint or license this article or any content from Poets & Quants, please submit your request HERE.


