






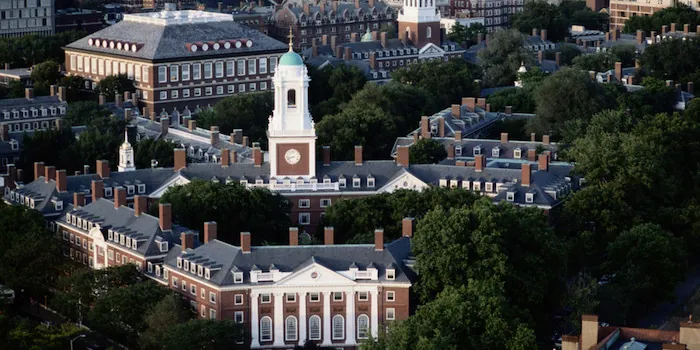
Harvard University in Cambridge, Mass.
METHODOLOGY
Unlike its undergraduate business program ranking, which is essentially a popularity contest, U.S. News weights most of its ranking on what happens to students after they enroll. Student outcomes account for 52% of a school’s overall score. The rankings evaluate more than 1,700 colleges and universities, ranking 400 of them, using as many as 17 measures of academic quality and graduate success.
Peer assessment remains a sizable 20% of the score, based on ratings from college presidents, provosts and deans. Faculty resources account for 11% for National Universities, financial resources for 8%, standardized test scores for 5%, and faculty research for 4%. SAT and ACT scores still matter, but if fewer than half of a school’s applicants submitted scores in successive years, U.S. News reallocates that weight to graduation rates. Acceptance rates, alumni giving, class size and high school class rank are not used to calculate the ranking.
Other ranking metrics include graduation rates (which account for 16% of the score), graduation-rate performance (10%), first-year retention (5%), Pell Grant graduation measures (11% combined), and two post-college earnings measures worth 5% each.
The biggest methodological change this year comes in that last category. U.S. News added graduates’ earnings by major as a new 5% ranking factor, replacing its measure of median federal student-loan debt. The measure is intended to compare graduates’ earnings while accounting for differences in the fields students study. Another 5% continues to measure the share of graduates who earn more than a typical high school graduate.
U.S. NEWS’ TOP 100 UNIVERSITIES |
|||||
2027 US Rank |
University |
2026 US Rank |
Change |
Tuition & fees |
Undergraduate enrollment |
| 1 | Massachusetts Institute of Technology | 2 | 1 | $67,140 | 4,561 |
| 2 | Princeton University | 1 | -1 | $68,454 | 5,916 |
| 3 | Harvard University | 3 | 0 | $68,442 | 6,738 |
| 4 | Yale University | 4 | 0 | $72,500 | 6,667 |
| 5 | California Institute of Technology | 11 | 6 | $71,229 | 971 |
| 5 | Stanford University | 4 | -1 | $68,574 | 7,346 |
| 7 | University of Pennsylvania | 7 | 0 | $73,978 | 9,989 |
| 8 | Duke University | 7 | -1 | $76,375 | 6,525 |
| 9 | Johns Hopkins University | 7 | -2 | $69,170 | 6,354 |
| 9 | Northwestern University | 7 | -2 | $73,062 | 9,039 |
| 9 | University of Chicago | 6 | -3 | $77,955 | 7,453 |
| 12 | Columbia University | 15 | 3 | $71,845 | 9,164 |
| 12 | Dartmouth College | 13 | 1 | $73,854 | 4,715 |
| 14 | Carnegie Mellon University | 20 | 6 | $70,816 | 7,728 |
| 14 | Cornell University | 12 | -2 | $74,970 | 16,138 |
| 16 | Brown University | 13 | -3 | $77,552 | 7,951 |
| 16 | Rice University | 17 | 1 | $70,720 | 4,807 |
| 16 | Vanderbilt University | 17 | 1 | $73,206 | 7,366 |
| 16 | Washington University in St. Louis | 20 | 4 | $72,722 | 8,153 |
| 20 | University of California, Berkeley | 15 | -5 | $57,736 ($18,466 in-state) | 33,513 |
| 20 | University of California, Los Angeles | 17 | -3 | $51,385 ($15,473 in-state) | 33,534 |
| 20 | University of Notre Dame | 20 | 0 | $69,794 | 8,950 |
| 23 | Emory University | 24 | 1 | $71,448 | 7,320 |
| 23 | Georgetown University | 24 | 1 | $74,732 | 7,908 |
| 25 | University of Michigan–Ann Arbor | 20 | -5 | $69,447 ($20,082 in-state) | 35,358 |
| 26 | University of Virginia | 26 | 0 | $65,223 ($24,847 in-state) | 17,848 |
| 27 | University of North Carolina–Chapel Hill | 26 | -1 | $49,601 ($9,359 in-state) | 22,007 |
| 27 | University of Southern California | 28 | 1 | $77,336 | 20,768 |
| 29 | Georgia Institute of Technology | 32 | 3 | $36,120 ($12,134 in-state) | 21,028 |
| 29 | University of California San Diego | 29 | 0 | $57,261 ($17,991 in-state) | 35,442 |
| 31 | Boston College | 36 | 5 | $76,424 | 9,677 |
| 31 | New York University | 32 | 1 | $68,576 | 29,471 |
| 31 | Tufts University | 36 | 5 | $76,558 | 7,031 |
| 34 | Boston University | 42 | 8 | $74,594 | 18,289 |
| 34 | University of California, Davis | 32 | -2 | $53,002 ($17,090 in-state) | 31,695 |
| 34 | University of California, Irvine | 32 | -2 | $51,893 ($15,981 in-state) | 30,260 |
| 34 | University of Florida | 30 | -4 | $34,616 ($6,436 in-state) | 37,283 |
| 34 | University of Illinois Urbana-Champaign | 36 | 2 | $41,110 ($18,434 in-state) | 38,572 |
| 34 | University of Texas–Austin | 30 | -4 | $44,816 ($11,656 in-state) | 44,314 |
| 34 | University of Wisconsin–Madison | 36 | 2 | $45,931 ($12,416 in-state) | 39,193 |
| 34 | Wake Forest University | 51 | 17 | $73,170 | 5,595 |
| 42 | Northeastern University | 46 | 4 | $72,700 | 17,130 |
| 42 | Villanova University | 57 | 15 | $74,014 | 6,935 |
| 44 | Case Western Reserve University | 51 | 7 | $72,106 | 6,534 |
| 44 | Lehigh University | 46 | 2 | $70,590 | 5,986 |
| 44 | The Ohio State University | 41 | -3 | $44,271 ($14,050 in-state) | 46,627 |
| 44 | Rutgers University–New Brunswick | 42 | -2 | $40,839 ($19,389 in-state) | 39,477 |
| 44 | University of California, Santa Barbara | 40 | -4 | $52,645 ($16,733 in-state) | 23,091 |
| 49 | University of Maryland, College Park | 42 | -7 | $44,086 ($12,834 in-state) | 31,875 |
| 49 | University of Rochester | 46 | -3 | $73,372 | 6,096 |
| 49 | University of Washington | 42 | -7 | $44,640 ($13,406 in-state) | 40,996 |
| 52 | University of Georgia | 46 | -6 | $33,298 ($11,628 in-state) | 32,824 |
| 52 | Virginia Tech | 51 | -1 | $39,577 ($17,087 in-state) | 31,536 |
| 52 | William & Mary | 51 | -1 | $53,678 ($27,235 in-state) | 6,951 |
| 55 | Pennsylvania State University–University Park | 59 | 4 | $45,214 ($21,518 in-state) | 42,822 |
| 55 | Purdue University–Main Campus | 46 | -9 | $28,794 ($9,992 in-state) | 43,633 |
| 55 | Santa Clara University | 59 | 4 | $65,736 | 6,695 |
| 55 | University of Miami | 64 | 9 | $68,374 | 13,241 |
| 59 | Brandeis University | 69 | 10 | $73,678 | 3,358 |
| 59 | Florida State University | 51 | -8 | $25,702 ($6,517 in-state) | 34,271 |
| 59 | George Washington University | 59 | 0 | $72,420 | 11,495 |
| 59 | Stevens Institute of Technology | 80 | 21 | $68,230 | 4,185 |
| 59 | Stony Brook University–SUNY | 59 | 0 | $37,241 ($10,931 in-state) | 18,615 |
| 59 | Texas A&M University | 51 | -8 | $40,847 ($12,878 in-state) | 62,031 |
| 59 | Tulane University of Louisiana | 69 | 10 | $75,134 | 6,839 |
| 59 | University of Massachusetts–Amherst | 64 | 5 | $43,299 ($19,212 in-state) | 24,019 |
| 59 | University of Minnesota–Twin Cities | 59 | 0 | $43,198 ($19,162 in-state) | 42,565 |
| 59 | University of Pittsburgh | 69 | 10 | $45,480 ($23,746 in-state) | 21,388 |
| 69 | Michigan State University | 64 | -5 | $46,094 ($19,742 in-state) | 41,415 |
| 69 | Rensselaer Polytechnic Institute | 64 | -5 | $67,976 | 5,833 |
| 69 | University of California, Merced | 57 | -12 | $51,927 ($16,015 in-state) | 8,234 |
| 72 | Syracuse University | 75 | 3 | $71,049 | 16,149 |
| 73 | Binghamton University–SUNY | 73 | 0 | $33,357 ($10,587 in-state) | 14,559 |
| 73 | Howard University | 88 | 15 | $38,936 | 11,084 |
| 73 | Indiana University–Bloomington | 73 | 0 | $42,703 ($12,144 in-state) | 38,463 |
| 73 | North Carolina State University | 64 | -9 | $34,961 ($9,247 in-state) | 29,340 |
| 73 | Rutgers University–Newark | 75 | 2 | $40,106 ($18,656 in-state) | 8,138 |
| 73 | University of Connecticut | 69 | -4 | $44,242 ($21,574 in-state) | 21,042 |
| 73 | Worcester Polytechnic Institute | 84 | 11 | $65,238 | 5,461 |
| 80 | Clemson University | 75 | -5 | N/A | 24,060 |
| 80 | Colorado School of Mines | 80 | 0 | $47,288 ($22,658 in-state) | 6,323 |
| 80 | Drexel University | 80 | 0 | $65,448 | 10,879 |
| 80 | Pepperdine University | 84 | 4 | $75,202 | 3,459 |
| 80 | University of California, Riverside | 75 | -5 | $56,061 ($16,791 in-state) | 24,034 |
| 85 | Fordham University | 97 | 12 | $70,474 | 10,383 |
| 85 | New Jersey Institute of Technology | 80 | -5 | $42,300 ($22,426 in-state) | 9,827 |
| 85 | Southern Methodist University | 88 | 3 | $71,816 | 7,545 |
| 85 | University at Buffalo–SUNY | 75 | -10 | $32,466 ($11,036 in-state) | 21,192 |
| 85 | University of Delaware | 88 | 3 | $45,020 ($18,290 in-state) | 19,519 |
| 90 | Baylor University | 88 | -2 | $67,756 | 14,183 |
| 90 | Gonzaga University | 102 | 12 | $59,510 | 4,976 |
| 90 | Marquette University | 88 | -2 | $55,090 | 8,206 |
| 90 | Texas Christian University | 97 | 7 | $66,610 | 11,152 |
| 90 | Yeshiva University | 84 | -6 | $54,500 | 2,318 |
| 95 | American University | 88 | -7 | $64,402 | 6,730 |
| 95 | Rochester Institute of Technology | 88 | -7 | $64,608 | 14,145 |
| 95 | Rutgers University–Camden | 97 | 2 | $40,660 ($19,210 in-state) | 4,020 |
| 95 | University of Illinois Chicago | 84 | -11 | $35,670 ($18,970 in-state) | 24,260 |
| 95 | University of Missouri | 102 | 7 | $39,324 ($16,162 in-state) | 25,141 |
| 100 | Auburn University | 102 | 2 | $37,596 ($13,572 in-state) | 28,953 |
| 100 | Chapman University | 110 | 10 | $70,394 | 7,630 |
| 100 | Creighton University | 117 | 17 | $52,902 | 4,833 |
| 100 | Elon University | 117 | 17 | $51,368 | 6,191 |
| 100 | Florida International University | 97 | -3 | $20,204 ($6,566 in-state) | 46,249 |
| 100 | Saint Louis University | 102 | 2 | $59,690 | 9,331 |
| 100 | University of Iowa | 102 | 2 | $34,247 ($11,971 in-state) | 23,407 |
| 100 | University of San Diego | 110 | 10 | $65,199 | 6,049 |
| 100 | University of South Florida | 88 | -12 | $18,416 ($6,410 in-state) | 39,093 |
DON’T MISS: POETS&QUANTS’ BEST UNDERGRADUATE BUSINESS SCHOOLS OF 2026 AND U.S. NEWS 2027 BEST BUSINESS SCHOOLS RANKING: WHARTON RECLAIMS THE SOLO CROWN
© Copyright 2026 Poets & Quants. All rights reserved. This article may not be republished, rewritten or otherwise distributed without written permission. To reprint or license this article or any content from Poets & Quants, please submit your request HERE.


