Remember your first day of high school? For me, it was August 22, 1984. And I didn’t know what to expect. I’d heard stories of seniors stuffing frosh into lockers and teachers tossing chalkboard erasers at sluggish students. Climbing the stairs, I questioned how I could possibly navigate this vast maze housing 1400 other students. More important, I wondered who my classmates would be (aside from those familiar faces from junior high).
Turns out, I adapted pretty easily. And I settled into a group that included a fellow jock, a bookworm, and a farmer. Over four years, my classmates and I endured the same rites of passage: broken hearts, brutal term papers, minimum wage jobs, campus visits, and athletic disappointments. Soon enough, we parted, with hugs and hollow promises, never really knowing each other like we thought.
For many, college is a second chance. Here, we can reinvent ourselves – and form those deep bonds that we were once too anxious to maintain. Like high school, we’ll still ask ourselves the same question as we step onto campus: Who are my classmates, really?
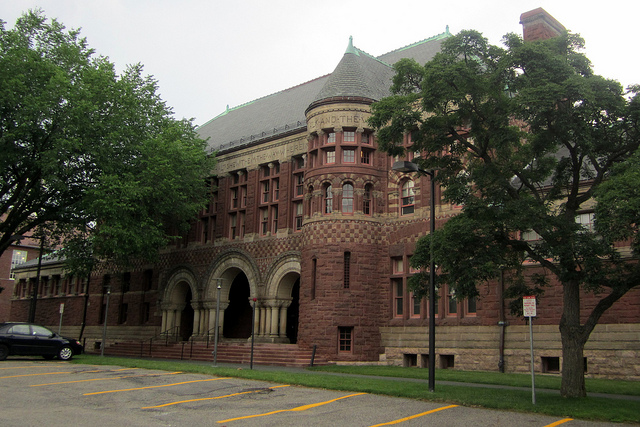
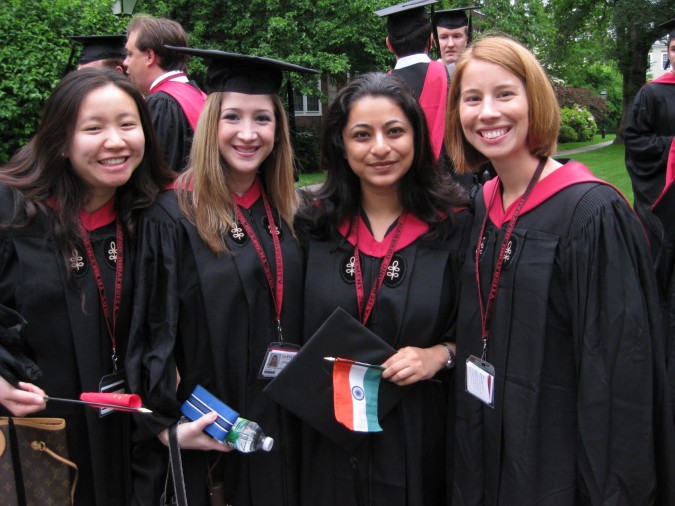
At Harvard, the student newspaper – The Crimson – is helping students learn just that. The Crimson sent surveys to the incoming class in early August, receiving a 70% response. From their backgrounds to their anticipated majors, the Class of 2018 is among the most diverse in the school’s history. If you’re looking to get into Harvard – or any Ivy for that matter – this is what you should expect.
White High Academic Achievers
Let’s start with the basics. Harvard’s Class of 2018 consists of 1667 students, drawn from a pool where the acceptance rate was 5.9%. Generally, these students are among the elite with The Ivy Coach reporting that 3,400 applicants were ranked first in their respective classes. Over a third of all applicants scored 700 or above on the critical reading and writing sections of the SAT – and nearly half scored that high on the math section. Ethnically, the highest SAT scores were earned by students who identified themselves as Indians (2312.6) and Asians (2304.5). Economically, students from households earning $250K-$500K produced the highest SAT averages (2287.4), with the lowest scores coming from students in households earning less than $40K (2154.8). The scores between genders were relatively even, with men holding a slim advantage in math and women scoring slightly higher in critical reasoning and writing. Legacies also scored 59 points higher than non-legacies. However, SAT scores for recruited athletes were 188 points below the class average.
The average unweighted GPA for an incoming freshman was 3.93 (on a 4.0 scale), though one student was admitted with a 3.3 average. Harvard freshmen reported taking the SAT an average 2.14 times and scored an average composite score of 2237, putting the average Harvard student in the top one percent of all SAT test takers. Even more scary: About eight percent of the students responding to the Crimson survey reported perfect 2400 scores on their SAT exams. Who blew everyone away? Students from Northeastern states tended to perform best, with an average score of 2253. Freshmen from outside the U.S. averaged the lowest test scores based on reported data, averaging a not-too-shabby 2197 on the SAT.
Those who got into Harvard really wanted to go to the school. Eighty-three percent of the surveyed students said that Harvard was their top choice, and, on average, students applied to 6.7 schools and were accepted to 4.6. The Crimson found that 16 percent of surveyed students said they used a private admissions counselor.
The class is comprised of 53% men and 46.5% women, down from the class of 2017’s near even split. Students also classified themselves under multiple ethnicities, including White (62%), Hispanic (12%), African-American (12%), Asian (24%) and Indian (5%). Between 1%-2% of students listed themselves as Native American or Pacific Islander. The majority of students – 43.1% – originate from the Northeast, followed by the West (16.9%), Midwest (11%), Southeast (10.6%), and Southwest (6.8%). An additional 12% of students come from overseas.
These numbers correlate quite closely with nearby rival Yale, where 10.4% of the incoming class is Latino and 13% attended school outside the United States according to The Yale Daily News. However, they don’t necessarily reflect the nation’s demographics, where 18% of the U.S. population lives in the northeast and 22% have settled in the Midwest according to the 2010 U.S. census. In addition, The Crimson reports that 69% of overseas students earned financial aid, compared to 53.8% from the incoming class as a whole.
Suburbanites Rule the Admissions Roll
Nearly two-thirds of the Class of 2018 (64.1%) hail from the suburbs, with urban (28.3%) and rural (7.6%) residents comprising the rest. This flies against the 2010 U.S. census, where only 10% of Americans live in suburbs (and 71% inhabit cities).
60% of Harvard’s incoming class graduated from public schools. However, nearly 40% matriculated at private schools, the majority at non-parochial schools (28.5%). Not surprisingly, 41.5% are the oldest child in their family, followed by youngest child (28.6%), only child (15%), and middle child (14.9%). Nearly 20% are athletes, with half intending to walk on. Over 90% identify themselves as heterosexual, with 5.5% of whom either questioning their sexuality or classifying themselves as bisexual.


Questions about this article? Email us or leave a comment below.