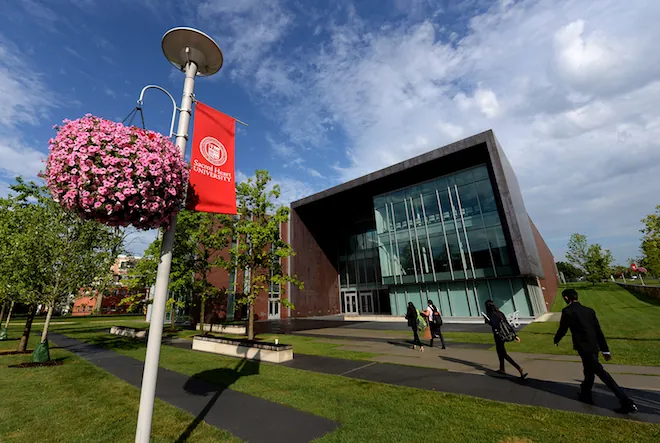
Sacred Heart University’s Jack Welch College of Business and Technology has enrolled a higher percentage of women than any other ranked business school for the last three admission cycles. Courtesy photo
Even as diversity, equity, and inclusion efforts come under political fire across the United States, many business schools remain committed to building classrooms that reflect the real world. That commitment shows up in the makeup of their student bodies: who gets in, who shows up, and who sees themselves in the business world to begin with.
At Poets&Quants, we believe these numbers matter. That’s why our annual ranking of the Best Undergraduate Business Schools includes four metrics tied directly to student diversity: the percentage of first-generation college students, underrepresented minorities, international students, and women.
Schools reported these percentages for the incoming class of Fall 2024 as part of our extensive data-collection process. Each is worth five points in our Admissions Standards category, because who you learn with is just as important as what you learn. Admission Standards is, in turn, worth one third of the total ranking. (See a full explanation of our methodology here.)
Why these four metrics? While there are many ways to define diversity, we selected these four based on their prevalence in business school DEI goals and their impact on classroom experience, team learning, and global competency.
IN PURSUIT OF GENDER PARITY
Attracting more women is often a stated goal of many top business schools. But despite these aspirations, gender parity remains elusive.
Sacred Heart University’s Jack Welch College of Business and Technology has enrolled a higher percentage of women than any other ranked business school for the last three admission cycles. Of 648 incoming business majors in Fall 2024, 66% of them were female. Some 62% of them were female in 2023 and 67.4% in 2022.
University of San Diego (Knauss) and University of Mary Washington each reported 64% of their incoming classes were female. Duquesne University (Palumbo Donahue) reported the third highest percentage of women at 63%. That’s 26.6% more than it enrolled the year before, the largest increase of all ranked programs.
WOMEN IN B-SCHOOL HIGHS & LOWS
HIGHEST |
||||
| 2025 Rank | School | 2024 % Women | 2023 % Women |
2022 % Women
|
| 85 | Sacred Heart University | 66.00% | 62.00% | 67.40% |
| 56 | University of San Diego (Knauss) | 64.00% | 58.00% | 61.00% |
| 84 | University of Mary Washington | 64.00% | ||
| 65 | Duquesne University (Palumbo Donahue) | 63.00% | 36.40% | 41.50% |
| 40 | University of Houston (Bauer) | 56.90% | 53.40% | 55.00% |
| 13 | Northeastern University (D’Amore-McKim) | 55.40% | 58.40% | 57.00% |
| 43 | Providence College | 55.10% | 56.34% | 53.60% |
| 17 | University of Richmond (Robins) | 55.00% | 47.20% | 51.00% |
| 27 | Trinity University (Neidorff) | 54.00% | ||
| 32 | University of Washington (Foster) | 53.70% | 53.00% | 50.70% |
| 78 | Roger Williams University (Gabelli) | 53.20% | 31.41% | NR |
| 16 | Boston University (Questrom) | 52.40% | 45.87% | 50.80% |
| 62 | University of St. Thomas (Opus) | 52.00% | ||
| 1 | University of Pennsylvania (Wharton) | 51.00% | 48.60% | 51.80% |
LOWEST |
||||
| 2025 Rank | School | 2024 % Women | 2023 % Women |
2022 % Women
|
| 36 | Purdue University (Daniels) | 35.00% | 33.00% | 35.00% |
| 26 | Lehigh University | 33.02% | 38.00% | 33.00% |
| 66 | Seton Hall University (Stillman) | 32.90% | 32.80% | 28.40% |
| 60 | Rochester Institute of Technology (Saunders) | 32.59% | 39.00% | 36.54% |
| 73 | Iona University (LaPenta) | 32.00% | ||
| 51 | Bryant University | 31.00% | ||
| 92 | Rensselaer Polytechnic Institute (Lally) | 29.00% | ||
| 82 | Ithaca College | 25.00% | 20.00% | 20.00% |
| 76 | Marian University (Indianapolis) | 24.10% | ||
| 42 | Worcester Polytechnic Institute | 21.00% | 20.00% | 32.00% |
In Fall 2024, just 14 of 104 ranked schools enrolled at least as many women as men in their incoming business classes. That compares to 16 of the 91 ranked schools in 2023 and15 of 92 ranked schools the year before.
On the other end of the spectrum, four business schools enrolled classes with fewer than 30% women and six others enrolled 35% or fewer. Worcester Polytechnic Institute reported the lowest percent of female classmates at 21%.
Across all 104 ranked schools, an average of 43.1% of the Fall 2024 business class were women. That’s a slight dip from 43.8% in 2023 and 43.4% in 2022.
The table below shows all school reported data for the percentage of women in the fall incoming classes of 2024, 2023 and 2022.
WOMEN AT P&Q RANKED B-SCHOOLS
2025 Rank |
School |
2024 % Women |
2023 % Women |
2022 % Women |
| 1 | University of Pennsylvania (Wharton) | 51.00% | 48.60% | 51.80% |
| 2 | Cornell University (Dyson SC Johnson) | 49.00% | 44.90% | 45.40% |
| 3 | University of Southern California (Marshall) | 49.00% | 53.00% | 53.00% |
| 4 | University of Virginia (McIntire) | 47.90% | 48.00% | 52.75% |
| 4 | Georgetown University (McDonough) | 39.81% | 40.60% | 35.83% |
| 5 | New York University (Stern) | 44.00% | 44.30% | 47.10% |
| 6 | Washington University in St. Louis (Olin) | 49.00% | 52.00% | 49.00% |
| 7 | University of Notre Dame (Mendoza) | 48.00% | 43.20% | 46.00% |
| 8 | Emory University (Goizueta) | 43.60% | 42.00% | 43.00% |
| 9 | University of North Carolina (Kenan-Flagler) | 43.40% | 42.90% | 46.00% |
| 10 | Carnegie Mellon University (Tepper) | 40.00% | 48.00% | 48.40% |
| 11 | University of Michigan (Ross) | 47.00% | 46.00% | 47.00% |
| 12 | Villanova University | 44.00% | 43.00% | 40.00% |
| 13 | Northeastern University (D’Amore-McKim) | 55.40% | 58.40% | 57.00% |
| 15 | Georgia Institute of Technology (Scheller) | 47.10% | 45.00% | 48.50% |
| 16 | Boston University (Questrom) | 52.40% | 45.87% | 50.80% |
| 17 | University of Richmond (Robins) | 55.00% | 47.20% | 51.00% |
| 18 | Wake Forest University | 43.00% | 45.00% | 39.00% |
| 19 | University of Illinois (Gies) | 42.36% | 46.20% | |
| 20 | William & Mary (Mason) | 45.00% | 46.10% | 42.00% |
| 21 | University of Miami (Herbert) | 41.20% | 39.95% | 34.00% |
| 22 | University of Wisconsin-Madison | 42.90% | 42.52% | 44.84% |
| 23 | Indiana University (Kelley) | 40.32% | 41.53% | 33.34% |
| 24 | University of Minnesota (Carlson) | 44.60% | 48.90% | 50.15% |
| 25 | Bucknell University (Freeman) | 42.00% | 49.00% | 41.00% |
| 26 | Lehigh University | 33.02% | 38.00% | 33.00% |
| 27 | Trinity University (Neidorff) | 54.00% | ||
| 28 | Texas Christian University (Neeley) | 42.90% | 44.70% | 45.48% |
| 29 | Fordham University (Gabelli) | 45.80% | 43.70% | 45.10% |
| 30 | Southern Methodist University (Cox) | 42.00% | 50.00% | 49.00% |
| 31 | Binghamton University | 37.20% | 37.20% | 36.60% |
| 32 | University of Washington (Foster) | 53.70% | 53.00% | 50.70% |
| 33 | University of Georgia (Terry) | 43.00% | 44.00% | 45.00% |
| 34 | University of Pittsburgh | 38.40% | 41.64% | 51.00% |
| 35 | Tulane University (Freeman) | 46.40% | 50.08% | 49.83% |
| 36 | Purdue University (Daniels) | 35.00% | 33.00% | 35.00% |
| 37 | Fairfield University (Dolan) | 41.00% | ||
| 38 | Elon University (Love) | 37.80% | 39.00% | 37.20% |
| 39 | Syracuse University (Whitman) | 46.36% | 53.14% | 45.53% |
| 40 | University of Houston (Bauer) | 56.90% | 53.40% | 55.00% |
| 41 | University of Massachusetts at Amherst (Isenberg) | 44.00% | ||
| 42 | Worcester Polytechnic Institute | 21.00% | 20.00% | 32.00% |
| 43 | Providence College | 55.10% | 56.34% | 53.60% |
| 44 | Rutgers Business School – New Brunswick | 40.95% | 42.80% | 43.50% |
| 45 | Miami University (Farmer) | 39.80% | 38.30% | 37.20% |
| 46 | Lipscomb University | 42.00% | 49.30% | 48.06% |
| 47 | Brigham Young University (Marriott) | 39.00% | ||
| 48 | Butler University (Lacy) | 41.59% | ||
| 49 | University of Dayton | 36.30% | 37.00% | 34.00% |
| 50 | Texas A&M University (Mays) | 48.30% | 50.16% | 47.30% |
| 51 | Bryant University | 31.00% | ||
| 52 | University of Delaware (Lerner) | 43.80% | 46.70% | 39.80% |
| 53 | The College of New Jersey | 37.00% | 40.40% | 36.00% |
| 54 | University of Tennessee (Haslam) | 39.90% | 40.30% | 43.85% |
| 55 | Loyola Marymount University | 39.70% | 43.00% | NR |
| 56 | University of San Diego (Knauss) | 64.00% | 58.00% | 61.00% |
| 57 | University of South Carolina (Darla Moore) | 48.62% | 50.06% | 42.78% |
| 58 | University of New Hampshire (Paul) | 36.90% | 41.60% | 40.50% |
| 59 | Hofstra University (Zarb) | 41.00% | 33.00% | 35.00% |
| 60 | Rochester Institute of Technology (Saunders) | 32.59% | 39.00% | 36.54% |
| 61 | Florida Southern College (Barnett) | 42.00% | 43.00% | 33.00% |
| 62 | University of St. Thomas (Opus) | 52.00% | ||
| 63 | University of Connecticut | 48.00% | ||
| 64 | St. John’s University (Tobin) | 38.00% | 34.00% | 39.00% |
| 65 | Duquesne University (Palumbo Donahue) | 63.00% | 36.40% | 41.50% |
| 66 | Seton Hall University (Stillman) | 32.90% | 32.80% | 28.40% |
| 67 | Saint Louis University (Chaifetz) | 36.95% | 45.38% | 39.50% |
| 68 | Michigan State University (Broad) | 37.50% | 37.80% | 45.30% |
| 69 | Drexel University (LeBow) | 39.90% | 43.00% | 45.00% |
| 70 | University of Texas at Dallas (Jindal) | 44.00% | 44.00% | 46.00% |
| 71 | University of Missouri-Columbia (Trulaske) | 36.10% | ||
| 72 | Hult International Business School | 41.00% | 37.00% | 41.00% |
| 73 | Iona University (LaPenta) | 32.00% | ||
| 74 | Towson University | 42.19% | 43.00% | 40.00% |
| 75 | Texas State University (McCoy) | 45.10% | ||
| 76 | Marian University (Indianapolis) | 24.10% | ||
| 77 | Seattle University (Albers) | 45.80% | 55.80% | 46.90% |
| 78 | Roger Williams University (Gabelli) | 53.20% | 31.41% | NR |
| 79 | Ohio University | 38.92% | 38.46% | 34.12% |
| 80 | Rutgers Business School – Newark | 42.00% | 40.30% | 44.00% |
| 81 | University of Denver (Daniels) | 48.56% | 48.80% | 48.70% |
| 82 | Ithaca College | 25.00% | 20.00% | 20.00% |
| 83 | Bowling Green State University (Schmidthorst) | 40.60% | 43.40% | 34.60% |
| 84 | University of Mary Washington | 64.00% | ||
| 85 | Sacred Heart University | 66.00% | 62.00% | 67.40% |
| 86 | University of the Pacific (Eberhardt) | 36.00% | 38.60% | 41.80% |
| 87 | University of North Carolina-Wilmington (Cameron) | 41.80% | 39.30% | 38.90% |
| 88 | Florida International University | 43.00% | 42.00% | 43.39% |
| 89 | Texas Tech University (Rawls) | 40.40% | 40.90% | 37.50% |
| 90 | University of Michigan-Dearborn | 44.00% | 41.90% | 42.80% |
| 91 | Saint Joseph’s University (Haub) | 36.50% | ||
| 92 | Rensselaer Polytechnic Institute (Lally) | 29.00% | ||
| 93 | American University (Kogod) | 42.00% | 47.00% | 52.00% |
| 94 | University of Kentucky (Gatton) | 40.71% | 41.94% | 44.13% |
| 95 | University of Akron | 38.11% | 61.82% | 33.43% |
| 96 | Oregon State University | 42.00% | 44.00% | |
| 97 | San Jose State University (Lucas) | 42.00% | ||
| 98 | Northern Illinois University | 43.20% | 37.10% | 38.10% |
| 99 | Iowa State University (Ivy) | 38.97% | ||
| 100 | University of Kansas | 44.13% | ||
| 101 | San Diego State University (Fowler) | 45.30% | 43.90% | 44.50% |
| 102 | Adelphi University (Willumstad) | 42.00% | ||
| 103 | University of Texas at Arlington | 47.39% | 48.24% | 49.75% |
| 104 | Kennesaw State University (Coles) | 39.00% |
NEXT PAGE: Percentage of first-generation college students
© Copyright 2026 Poets & Quants. All rights reserved. This article may not be republished, rewritten or otherwise distributed without written permission. To reprint or license this article or any content from Poets & Quants, please submit your request HERE.


