
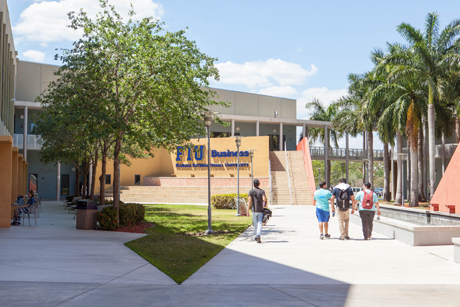
No other school had a higher percentage of U.S. minorities entering their business school this past fall (2024) than Florida International University at 75%.
UNDERREPRESENTED MINORITY STUDENTS
In June 2023, the U.S. Supreme Court struck down affirmative action in college admissions, ruling in favor of lawsuits brought by Students for Fair Admissions against Harvard and the University of North Carolina. The decision left many universities – and their business schools – reassessing how they attract and support underrepresented students.
Since his re-election in 2024, President Donald Trump has intensified efforts to dismantle DEI programs across higher education. His administration launched civil rights investigations into dozens of universities, including Harvard, alleging that DEI initiatives constitute unlawful racial discrimination under Title VI of the Civil Rights Act.
The Department of Education has warned institutions that continued engagement in DEI activities could jeopardize their federal funding. Trump has also signed executive orders directing the Department to scrutinize accrediting bodies for enforcing DEI-related standards, threatening to revoke recognition from those that do.
In a global business environment, however, classroom diversity isn’t just a value but a competitive advantage. A 2023 Niche survey of 20,000 high school seniors found that 42% considered diversity in the campus community “appealing,” and 38% called it a “must have” when choosing a college.
We think it matters too. That’s why we ask schools to report the percentage of underrepresented U.S. minorities (URM) in their incoming business classes. (URM is defined as Black or African-Americans, Hispanic or Latino, mixed races, American Indians or Alaska Natives, Native Hawaiians, and other Pacific Islanders).
No other school had a higher percentage of U.S. minorities entering their business school this past fall (2024) than Florida International University at 75%. That’s down slightly from the 76% the school reported for fall 2023 but up from fall 2022 when it reported 74.4%.
Northern Illinois University had the second highest percentage at underrepresented minority students at 60%.
In the fall 2024 incoming class, six schools enrolled a higher percentage of minority students than non minority compared to four schools in fall 2023 and five schools in 2022. Eighteen schools reported minority students percentages of 40% or higher, compared to just nine schools in 2023.
URM HIGHS & LOWS
HIGHEST |
||||
| 2025 Rank | School | 2024 % URM | 2023 % URM | 2022 % URM |
| 88 | Florida International University | 75.00% | 76.00% | 74.38% |
| 98 | Northern Illinois University | 60.00% | 61.80% | 59.60% |
| 40 | University of Houston (Bauer) | 57.10% | 52.70% | 50.40% |
| 103 | University of Texas at Arlington | 56.49% | 61.37% | 61.29% |
| 104 | Kennesaw State University (Coles) | 52.00% | ||
| 59 | Hofstra University (Zarb) | 51.00% | 34.00% | 30.00% |
| 86 | University of the Pacific (Eberhardt) | 49.00% | 34.10% | 47.10% |
| 73 | Iona University (LaPenta) | 48.00% | ||
| 80 | Rutgers Business School – Newark | 47.40% | 47.10% | 49.20% |
| 27 | Trinity University (Neidorff) | 46.60% | ||
| 75 | Texas State University (McCoy) | 46.30% | ||
| 101 | San Diego State University (Fowler) | 46.22% | 33.80% | 31.50% |
LOWEST |
||||
| 2025 Rank | School | 2024 % URM | 2023 % URM | 2022 % URM |
| 18 | Wake Forest University | 9.00% | 11.00% | 10.00% |
| 92 | Rensselaer Polytechnic Institute (Lally) | 9.00% | ||
| 10 | Carnegie Mellon University (Tepper) | 8.00% | 20.00% | 23.00% |
| 58 | University of New Hampshire (Paul) | 5.20% | 3.96% | 4.80% |
| 22 | University of Wisconsin-Madison | 5.10% | 19.00% | 29.76% |
| 47 | Brigham Young University (Marriott) | 5.00% | ||
| 94 | University of Kentucky (Gatton) | 4.73% | 14.98% | 12.22% |
At the other end, the University of Kentucky (Gatton) reported just 4.7% minority enrollment, down from 15% in 2023. Brigham Young University (Marriott) reported 5%, and the University of Wisconsin–Madison reported 5.1%.
Eight schools reported enrolling incoming classes with 10% or fewer minority students.
Across all ranked programs, underrepresented minorities made up 24.6% of the Fall 2024 business class—up slightly from 24.4% in 2023 and 23.7% in 2022.
The table below shows all school reported data for the percentage of first-generation college students in the fall incoming classes of 2024, 2023 and 2022.
2025 Rank |
School |
2024 % URM |
2023 % URM |
2022 % URM |
| 1 | University of Pennsylvania (Wharton) | 24.20% | 32.00% | 22.60% |
| 2 | Cornell University (Dyson SC Johnson) | 19.70% | 29.80% | 26.40% |
| 3 | University of Southern California (Marshall) | 27.00% | 29.60% | 25.40% |
| 4 | University of Virginia (McIntire) | 20.30% | 21.00% | 22.14% |
| 4 | Georgetown University (McDonough) | 26.00% | 21.00% | 19.00% |
| 5 | New York University (Stern) | 12.00% | 25.90% | 24.20% |
| 6 | Washington University in St. Louis (Olin) | 21.00% | 31.00% | 28.00% |
| 7 | University of Notre Dame (Mendoza) | 18.00% | 17.60% | 18.40% |
| 8 | Emory University (Goizueta) | 17.30% | 18.00% | 16.00% |
| 9 | University of North Carolina (Kenan-Flagler) | 15.90% | 16.50% | 15.00% |
| 10 | Carnegie Mellon University (Tepper) | 8.00% | 20.00% | 23.00% |
| 11 | University of Michigan (Ross) | 22.00% | 22.00% | 17.00% |
| 12 | Villanova University | 20.00% | 12.00% | 18.00% |
| 13 | Northeastern University (D’Amore-McKim) | 22.70% | 21.00% | 21.00% |
| 15 | Georgia Institute of Technology (Scheller) | 15.80% | 26.50% | 28.80% |
| 16 | Boston University (Questrom) | 13.00% | 22.00% | 17.30% |
| 17 | University of Richmond (Robins) | 22.00% | 14.30% | 20.00% |
| 18 | Wake Forest University | 9.00% | 11.00% | 10.00% |
| 19 | University of Illinois (Gies) | 11.80% | 16.50% | 17.60% |
| 20 | William & Mary (Mason) | 34.00% | 30.70% | 31.00% |
| 21 | University of Miami (Herbert) | 32.00% | 26.98% | 30.00% |
| 22 | University of Wisconsin-Madison | 5.10% | 19.00% | 29.76% |
| 23 | Indiana University (Kelley) | 11.49% | 14.54% | 10.58% |
| 24 | University of Minnesota (Carlson) | 12.50% | 12.00% | 8.40% |
| 25 | Bucknell University (Freeman) | 15.00% | 22.00% | 24.00% |
| 26 | Lehigh University | 17.67% | 17.00% | 18.00% |
| 27 | Trinity University (Neidorff) | 46.60% | ||
| 28 | Texas Christian University (Neeley) | 23.70% | 18.10% | 13.10% |
| 29 | Fordham University (Gabelli) | 29.60% | 23.70% | 22.20% |
| 30 | Southern Methodist University (Cox) | 36.00% | 20.00% | 19.00% |
| 31 | Binghamton University | 12.10% | 19.00% | 19.30% |
| 32 | University of Washington (Foster) | 21.20% | 25.10% | 20.10% |
| 33 | University of Georgia (Terry) | 15.50% | 16.22% | 15.30% |
| 34 | University of Pittsburgh | 11.67% | 13.68% | 16.00% |
| 35 | Tulane University (Freeman) | 16.80% | 19.07% | 21.38% |
| 36 | Purdue University (Daniels) | 12.00% | 14.00% | 11.00% |
| 37 | Fairfield University (Dolan) | 11.00% | ||
| 38 | Elon University (Love) | 19.00% | 13.70% | 16.70% |
| 39 | Syracuse University (Whitman) | 22.00% | 22.48% | 17.41% |
| 40 | University of Houston (Bauer) | 57.10% | 52.70% | 50.40% |
| 41 | University of Massachusetts at Amherst (Isenberg) | 12.00% | ||
| 42 | Worcester Polytechnic Institute | 11.00% | 3.00% | 11.00% |
| 43 | Providence College | 13.80% | 14.53% | 15.35% |
| 44 | Rutgers Business School – New Brunswick | 17.60% | 17.10% | 24.00% |
| 45 | Miami University (Farmer) | 10.00% | 8.40% | 34.10% |
| 46 | Lipscomb University | 39.00% | 35.50% | 20.93% |
| 47 | Brigham Young University (Marriott) | 5.00% | ||
| 48 | Butler University (Lacy) | 28.76% | ||
| 49 | University of Dayton | 13.90% | 16.00% | 12.00% |
| 50 | Texas A&M University (Mays) | 38.72% | 22.66% | 24.60% |
| 51 | Bryant University | 20.20% | ||
| 52 | University of Delaware (Lerner) | 13.90% | 18.00% | 12.80% |
| 53 | The College of New Jersey | 38.00% | 39.00% | 37.00% |
| 54 | University of Tennessee (Haslam) | 14.20% | 10.90% | 12.87% |
| 55 | Loyola Marymount University | 38.48% | 41.00% | NR |
| 56 | University of San Diego (Knauss) | 45.00% | 42.30% | 50.00% |
| 57 | University of South Carolina (Darla Moore) | 11.40% | 12.61% | 12.03% |
| 58 | University of New Hampshire (Paul) | 5.20% | 3.96% | 4.80% |
| 59 | Hofstra University (Zarb) | 51.00% | 34.00% | 30.00% |
| 60 | Rochester Institute of Technology (Saunders) | 22.96% | 23.60% | 21.15% |
| 61 | Florida Southern College (Barnett) | 32.00% | 25.00% | 19.00% |
| 62 | University of St. Thomas (Opus) | 31.00% | ||
| 63 | University of Connecticut | 27.15% | ||
| 64 | St. John’s University (Tobin) | 43.00% | 38.00% | 39.00% |
| 65 | Duquesne University (Palumbo Donahue) | 19.80% | 13.80% | 15.80% |
| 66 | Seton Hall University (Stillman) | 42.60% | 45.50% | 38.50% |
| 67 | Saint Louis University (Chaifetz) | 21.73% | 18.85% | 16.81% |
| 68 | Michigan State University (Broad) | 13.40% | 10.70% | 10.70% |
| 69 | Drexel University (LeBow) | 17.90% | 15.00% | 13.00% |
| 70 | University of Texas at Dallas (Jindal) | 31.60% | 29.70% | 36.00% |
| 71 | University of Missouri-Columbia (Trulaske) | 12.30% | ||
| 72 |
Hult International Business School
|
|||
| 73 | Iona University (LaPenta) | 48.00% | ||
| 74 | Towson University | 40.63% | 48.00% | 42.00% |
| 75 | Texas State University (McCoy) | 46.30% | ||
| 76 | Marian University (Indianapolis) | 44.30% | 37.50% | 25.60% |
| 77 | Seattle University (Albers) | 26.29% | 34.80% | 22.30% |
| 78 | Roger Williams University (Gabelli) | 19.30% | 21.79% | NR |
| 79 | Ohio University | 10.97% | 11.18% | 12.00% |
| 80 | Rutgers Business School – Newark | 47.40% | 47.10% | 49.20% |
| 81 | University of Denver (Daniels) | 20.50% | 29.00% | 26.66% |
| 82 | Ithaca College | 33.00% | 22.00% | 22.00% |
| 83 | Bowling Green State University (Schmidthorst) | 11.79% | 14.80% | 7.90% |
| 84 | University of Mary Washington | 31.00% | ||
| 85 | Sacred Heart University | 24.00% | 17.00% | 23.50% |
| 86 | University of the Pacific (Eberhardt) | 49.00% | 34.10% | 47.10% |
| 87 | University of North Carolina-Wilmington (Cameron) | 11.60% | 12.10% | 7.20% |
| 88 | Florida International University | 75.00% | 76.00% | 74.38% |
| 89 | Texas Tech University (Rawls) | 35.20% | 30.99% | 40.20% |
| 90 | University of Michigan-Dearborn | 11.00% | 14.80% | 15.20% |
| 91 | Saint Joseph’s University (Haub) | 26.00% | ||
| 92 | Rensselaer Polytechnic Institute (Lally) | 9.00% | ||
| 93 | American University (Kogod) | 34.00% | 29.00% | 27.00% |
| 94 | University of Kentucky (Gatton) | 4.73% | 14.98% | 12.22% |
| 95 | University of Akron | 30.95% | 26.50% | 23.71% |
| 96 | Oregon State University | 21.00% | 10.00% | |
| 97 | San Jose State University (Lucas) | 38.00% | ||
| 98 | Northern Illinois University | 60.00% | 61.80% | 59.60% |
| 99 | Iowa State University (Ivy) | 17.10% | ||
| 100 | University of Kansas | 17.67% | ||
| 101 | San Diego State University (Fowler) | 46.22% | 33.80% | 31.50% |
| 102 | Adelphi University (Willumstad) | 40.00% | ||
| 103 | University of Texas at Arlington | 56.49% | 61.37% | 61.29% |
| 104 | Kennesaw State University (Coles) | 52.00% |
NEXT PAGE: Percentage of international students
© Copyright 2026 Poets & Quants. All rights reserved. This article may not be republished, rewritten or otherwise distributed without written permission. To reprint or license this article or any content from Poets & Quants, please submit your request HERE.


