




Choosing a college is incredibly big decision. Questionably one of the most important decisions one will make in their life.
A college education should challenge students academically. It should prepare students for the working world. It should provide opportunities that make the cost of attendance worthwhile.
There are so many to choose from – so how on earth do you know which school to choose?
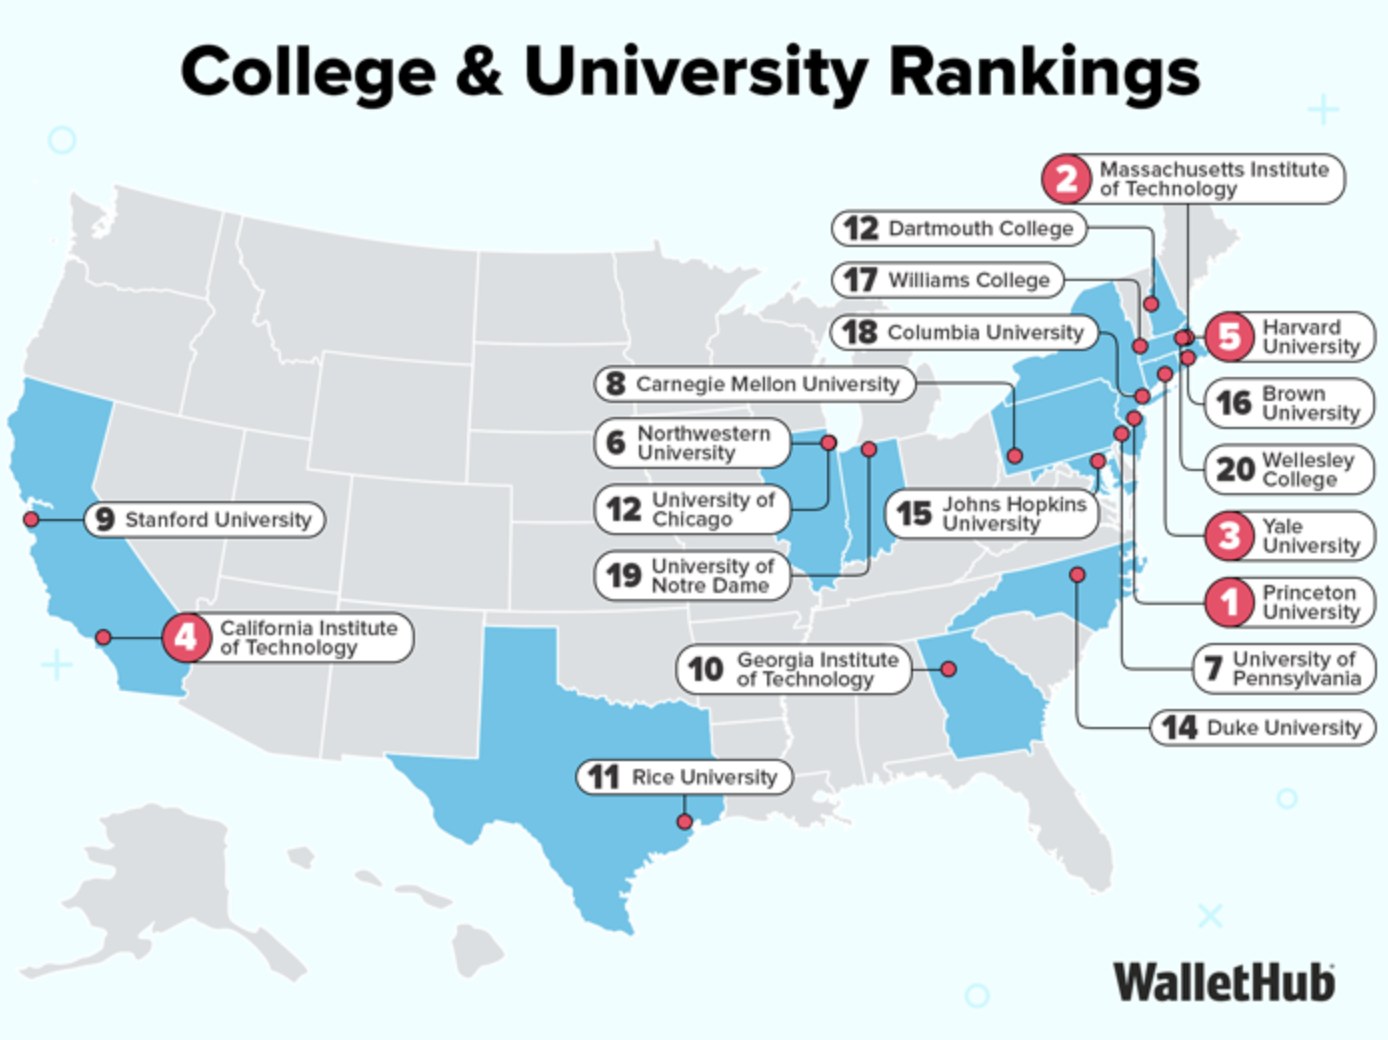
WalletHub’s newly released 2027 College & University Rankings is a great place to kick off your search. This personal finance website compared 738 U.S. institutions across 30 measurements, covering everything from admission rates and graduation outcomes to student debt and post-college earnings. Depending on what matters to each student most, these rankings can help students find the right fit.
WALLETHUB’S TOP 50 SCHOOLS
| Overall Rank* | Percentile (99=Best) | University/College | State | Total Score** | Student Selectivity Rank | Cost & Financing Rank | Faculty Resources Rank | Campus Safety Rank | Campus Experience Rank | Education Outcomes Rank | Career Outcomes Rank |
|---|---|---|---|---|---|---|---|---|---|---|---|
| 1 | 99 | Princeton University | NJ | 80.76 | 10 | 583 | 9 | 461 | 26 | 8 | 20 |
| 2 | 99 | Massachusetts Institute of Technology | MA | 79.62 | 5 | 656 | 2 | 272 | 55 | 9 | 11 |
| 3 | 99 | Yale University | CT | 79.53 | 8 | 618 | 12 | 571 | 53 | 6 | 8 |
| 4 | 99 | California Institute of Technology | CA | 79.27 | 1 | 670 | 1 | 652 | 31 | 25 | 1 |
| 5 | 99 | Harvard University | MA | 78.71 | 2 | 664 | 16 | 245 | 15 | 4 | 16 |
| 6 | 99 | Northwestern University | IL | 76.96 | 15 | 674 | 6 | 227 | 67 | 16 | 37 |
| 7 | 99 | University of Pennsylvania | PA | 76.8 | 9 | 700 | 35 | 230 | 87 | 5 | 2 |
| 8 | 99 | Carnegie Mellon University | PA | 76.79 | 32 | 678 | 10 | 92 | 28 | 22 | 15 |
| 9 | 99 | Stanford University | CA | 76.78 | 3 | 680 | 63 | 397 | 22 | 33 | 24 |
| 10 | 99 | Georgia Institute of Technology | GA | 76.76 | 45 | 255 | 594 | 261 | 295 | 26 | 13 |
| 11 | 99 | Rice University | TX | 76.69 | 16 | 666 | 4 | 632 | 58 | 11 | 28 |
| 12 | 98 | Dartmouth College | NH | 76.47 | 12 | 640 | 58 | 653 | 47 | 2 | 40 |
| 12 | 98 | University of Chicago | IL | 76.47 | 6 | 723 | 3 | 229 | 16 | 3 | 33 |
| 14 | 98 | Duke University | NC | 76.29 | 13 | 721 | 8 | 452 | 69 | 1 | 9 |
| 15 | 98 | Johns Hopkins University | MD | 76.13 | 4 | 682 | 5 | 286 | 80 | 36 | 86 |
| 16 | 98 | Brown University | RI | 75.97 | 10 | 708 | 11 | 517 | 49 | 12 | 25 |
| 17 | 98 | Williams College | MA | 75.96 | 18 | 660 | 19 | 481 | 34 | 20 | 53 |
| 18 | 98 | Columbia University | NY | 75.94 | 7 | 706 | 44 | 105 | 3 | 7 | 44 |
| 19 | 97 | University of Notre Dame | IN | 75.85 | 26 | 647 | 42 | 386 | 129 | 17 | 22 |
| 20 | 97 | Wellesley College | MA | 75.56 | 33 | 614 | 56 | 191 | 30 | 47 | 63 |
| 21 | 97 | Pomona College | CA | 75.39 | 22 | 639 | 25 | 676 | 1 | 23 | 111 |
| 22 | 97 | Vanderbilt University | TN | 75.02 | 14 | 679 | 23 | 711 | 29 | 30 | 36 |
| 23 | 97 | Washington and Lee University | VA | 75.02 | 40 | 649 | 21 | 380 | 142 | 27 | 26 |
| 24 | 97 | University of North Carolina–Chapel Hill | NC | 75.01 | 54 | 267 | 433 | 426 | 565 | 40 | 107 |
| 25 | 97 | University of Florida | FL | 74.44 | 62 | 89 | 442 | 78 | 455 | 37 | 295 |
| 26 | 96 | Harvey Mudd College | CA | 74.34 | 24 | 702 | 77 | 523 | 71 | 46 | 3 |
| 27 | 96 | Amherst College | MA | 74.23 | 23 | 655 | 24 | 663 | 41 | 19 | 144 |
| 28 | 96 | Colby College | ME | 74.12 | 30 | 665 | 46 | 287 | 11 | 64 | 82 |
| 29 | 96 | Bowdoin College | ME | 73.78 | 19 | 697 | 37 | 539 | 84 | 12 | 70 |
| 30 | 96 | Grinnell College | IA | 73.72 | 51 | 558 | 51 | 253 | 9 | 70 | 243 |
| 31 | 96 | Cornell University | NY | 73.66 | 25 | 709 | 87 | 224 | 213 | 15 | 19 |
| 32 | 96 | Cooper Union for the Advancement of Science and Art | NY | 73.65 | 58 | 313 | 86 | 1 | 677 | 132 | 80 |
| 33 | 96 | University of California, Berkeley | CA | 73.63 | 41 | 442 | 558 | 687 | 302 | 14 | 31 |
| 34 | 95 | Hamilton College | NY | 73.52 | 35 | 645 | 93 | 369 | 79 | 43 | 69 |
| 34 | 95 | Middlebury College | VT | 73.52 | 28 | 652 | 65 | 350 | 13 | 42 | 112 |
| 36 | 95 | Washington University in St. Louis | MO | 73.17 | 31 | 706 | 7 | 375 | 97 | 29 | 87 |
| 37 | 95 | University of Virginia | VA | 73.03 | 43 | 599 | 384 | 429 | 470 | 10 | 38 |
| 38 | 95 | Claremont McKenna College | CA | 72.91 | 42 | 713 | 17 | 678 | 6 | 37 | 18 |
| 39 | 95 | University of California, San Diego | CA | 72.66 | 59 | 278 | 691 | 713 | 96 | 72 | 57 |
| 40 | 95 | Barnard College | NY | 72.61 | 21 | 692 | 139 | 430 | 62 | 34 | 92 |
| 41 | 94 | Davidson College | NC | 72.55 | 46 | 657 | 43 | 302 | 70 | 44 | 116 |
| 42 | 94 | Carleton College | MN | 72.5 | 53 | 626 | 15 | 594 | 51 | 57 | 172 |
| 43 | 94 | Emory University | GA | 72.29 | 37 | 688 | 97 | 496 | 27 | 28 | 89 |
| 44 | 94 | University of Michigan–Ann Arbor | MI | 72.25 | 48 | 563 | 316 | 409 | 453 | 31 | 74 |
| 45 | 94 | University of Southern California | CA | 72.25 | 38 | 696 | 114 | 263 | 86 | 35 | 43 |
| 46 | 94 | Swarthmore College | PA | 72.18 | 20 | 693 | 30 | 730 | 52 | 39 | 81 |
| 47 | 94 | Boston College | MA | 72.16 | 36 | 699 | 410 | 173 | 76 | 48 | 21 |
| 48 | 93 | Florida State University | FL | 71.64 | 67 | 125 | 419 | 163 | 628 | 62 | 311 |
| 49 | 93 | Trinity University | TX | 71.57 | 72 | 512 | 40 | 567 | 107 | 100 | 130 |
| 50 | 93 | Boston University | MA | 71.41 | 34 | 681 | 254 | 84 | 37 | 52 | 120 |
PRINCETON TAKES THE LEAD
Princeton landed in the No. 1 place in this year’s ranking. This is a university that’s notoriously hard to get into, admitting just 5% of applicants. Impressively, 93% of its incoming students graduated in the top 10% of their high school classes. The student/faculty ratio here is quite incredible, with just five students for every professor. Students at Princeton tend to come to the school and see their degrees through more than most, with a 98% graduation rate. That’s the highest of any school in the country, Wallethub found.
Right behind Princeton is the Massachusetts Institute of Technology (MIT) at No. 2. This school has got quite a few impressive numbers of its own. MIT’s student-faculty ratio is even smaller than Princeton’s, at three to one. Graduates here earn a median salary of more than $143,000 ten years after enrollment. Princeton’s median is just over $110,000. That’s quite the big difference.
Yale University takes the No. 3 spot. This is a school with some of the country’s most recognizable names in higher education. Yale’s strongest scores are in career outcomes, where it ranks No. 8, and educational outcomes, where it ranks No. 6. Those results helped Yale edge out other top schools, giving it a total score of 79.53 — just a fraction behind MIT’s 79.62.
Some smaller colleges are holding their own against these powerhouses too. Wellesley College ranks No. 20 overall, Pomona College comes in at No. 21, and Harvey Mudd College lands at No. 26. They may not have the same name recognition as Princeton, MIT, or Yale, but their numbers sure help them make a compelling case for looking beyond the biggest brands when choosing a college.
HOW WALLETHUB RANKS SCHOOLS
WalletHub evaluates institutions using 30 metrics grouped into seven categories. Each category contributes a specific percentage to the overall score, adding up to 100%.
Student Selectivity — 25%. This is the largest category. WalletHub considers admission rates, ACT and SAT scores at the 25th and 75th percentiles, and the share of freshmen who graduated in the top 10% of their high school class. Admission rate receives triple weight.
Cost & Financing — 20%. College is a major investment, so WalletHub looks at net cost, student-loan debt, and whether a school offers employment services to help students find part-time work. Net cost receives triple weight, while the other two metrics receive full weight.
Educational Outcomes — 20%. Retention rates, graduation rates, and the number of bachelor’s degrees awarded relative to undergraduate enrollment help measure how successfully a school moves students toward graduation. Graduation rate receives double weight, while retention and credentials awarded receive full weight.
Career Outcomes — 15%. This category looks at return on educational investment, full-time job offers within six months of graduation, median salary ten years after enrollment, earnings compared with high school graduates, student-loan repayment, and student-loan default rates. Full-time employment, median salary, and debt reduction receive double weight.
Faculty Resources — 10%. This category looks at student-faculty ratios, average class size, the share of full-time professors among full-time instructional staff, the share of faculty employed full-time, and faculty salaries adjusted for cost of living. Student-faculty ratio receives quadruple weight, average class size triple weight, the share of full-time professors half weight, the share of full-time faculty quarter weight, and faculty salary full weight.
Campus Safety — 5%. WalletHub measures on-campus arrests and on-campus crime relative to total enrollment, giving each measure full weight. Safety accounts for just a tiny portion of the overall score, at just 5%.
Campus Experience — 5%. WalletHub considers international student enrollment, campus housing, NCAA membership, study-abroad programs, gender and racial diversity, earnings from on-campus employment, and graduate placement services. International enrollment and campus housing receive double weight; most other measures receive full weight, while graduate placement services receive half weight.
SMALLER SCHOOLS DESERVE SOME ATTENTION
Some of the most interesting findings popped up in schools that don’t typically dominate national conversations. Wellesley College in Massachusetts ranks No. 20 overall, followed by California’s Pomona College at No. 21. Harvey Mudd College, also in California, ranks No. 26 and leads the country in return on educational investment. Wellesley has just seven students for every faculty member and a 96% retention rate from the first year to the second. Harvey Mudd stands out for the financial returns its graduates receive relative to their educational investment.
Why do universities tend to dominate the top of the list?
“In general, universities tend to rank higher than colleges due to their inclusion of graduate-level programs, greater on-campus opportunities and higher earnings for students post-graduation,” shares Chip Lupo, WalletHub analyst. “In fact, the top 10 places for higher education in the U.S. are all universities. There are still tons of high-ranking colleges, though, which offer their own advantages like smaller class sizes, more personalized learning and often safer campuses.”
A university might have a wider range of programs and campus opportunities, while a smaller college may give undergraduates closer access to professors and a more personalized learning experience. Choosing which is best for you just depends on what you value the most.
Geographically, the Northeast is home to several of the highest-ranked institutions, including Princeton, MIT, Yale, Harvard, and Wellesley. California also has a ton of the top schools from this ranking, with Caltech, Stanford, Pomona, and Harvey Mudd among the leading schools.
IS PRESTIGE WORTH THE INVESTMENT?
Some universities have an outstanding reputation, impressive graduate salaries, and a powerful alumni network. Is that what student’s should strive for? Is it worth paying substantially more to attend? This is what many students are asking themselves these days.
Dr. Gerardo L. Blanco, associate professor and academic director of the Center for International Higher Education at Boston College beleives the answer depends on what students hope to gain.
“Any conversation about worth needs to take into consideration individual goals,” Blanco says. “Some of the most prestigious institutions have strong brands, because they offer good outcomes for graduates and provide access to networks that provide or reinforce access to opportunities.”
Blanco cautions against choosing a college based on its reputation alone. “Anyone pursuing an institution based in reputation alone should be cautious, as we have seen that reputations can change in a relatively short time,” he explains.
Tristan N. Jones, the Coordinator for recruitment and admissions at Langston University says that in some ways, prestige can be worth the investment.
“During the first two years, most students everywhere are taking similar general classes,” she says. “The real advantage of Ivy League and other elite schools comes from their reputation, alumni networks, and name recognition. Still, a well-known name does not always mean that graduates are the most qualified — often, it reflects who could afford to attend.
DON’T MISS FORBES’ BEST COLLEGE: MIT HOLDS NO. 1 AS UPENN & CALTECH CLIMB
© Copyright 2026 Poets & Quants. All rights reserved. This article may not be republished, rewritten or otherwise distributed without written permission. To reprint or license this article or any content from Poets & Quants, please submit your request HERE.


